
PHP profiling saved one of my meagre website's users 13 hours per month
26-09-2014
That surprised me too. But at 100,000 pageviews per month, and looking at an average load time of 0.5s before and 0.03s after my two minor optimisations, I make it just over 13 hours. What happens to that extra time now? Do I get more pageviews or do Facebook and Twitter see the majority of the benefit?
Skip to the howto
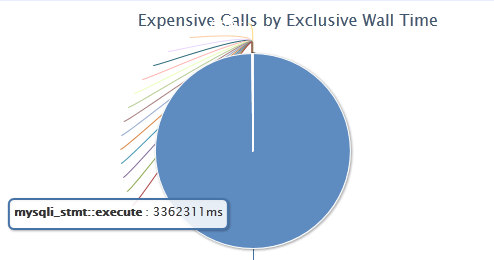
Before finding where my code was slow I didn't know where to look. Now I don't need to guess. Over 3 seconds crunching MySQL:
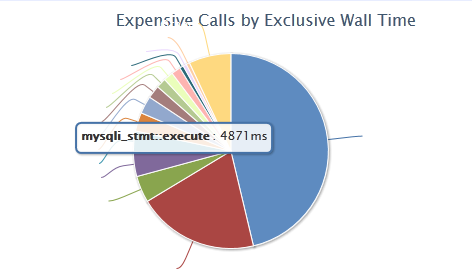
After a few minutes I'd to cut out a load of calls and optimise the ones I did still need:
What is xhprof?
The xhprof PHP extension itself was developed and open-sourced by Facebook a few years ago. It analyzes your PHP as it runs and reports on time taken to run each function. It's within the PECL repository so in theory it's a straight foward install. The front end I used is a slightly modified version by Paul Reinheimer (GitHub).
How to install xhprof on a standard LAMP system
This assumes you've got a standard CentOS installation with Apache, MySQL and PHP already installed. Take a look over here to see how to do this.
There's not much to the install that Google can't help with. I had an error when I tried "pecl install xhprof" but this worked:
yum install php-devel php-pear
pecl install channel://pecl.php.net/xhprof-0.9.4
Enable the extension within php.ini, or more commonly in /etc/php.d/*.ini
cat >/etc/php.d/xhprof.ini <<EOF
[xhprof]
extension=xhprof.so
xhprof.output_dir="/tmp/xhprof"
EOF
Instaling the GUI front-end is a slightly more involved: Downloading some PHP; modify a config file; create a database and table.
You can either put the code in an existing DocumentRoot or create a new vhost and give it its own subdomain. I've explaind the new vhost option but to simplfy you could unzip it straight into /var/www/html (or wherever your existing DocumentRoot is) and access using your existing domain: http://example.com/xhprof-master.
curl https://github.com/preinheimer/xhprof/archive/master.zip -L -o /tmp/xhprof.zip
cd /var/www
unzip /tmp/xhprof.zip
Create and modify the config file to reflect your local system. Make a new database user.
cp /var/www/xhprof-master/xhprof-lib/config.sample.php /var/www/xhprof-master/xhprof-lib/config.php
Modify the new config.php with Vim, Emacs, gedit or your editor of choice. Make sure to add database and server details, and adding your IP address to the $controlIPs array. If you're not sure, click here to find your IP.
Create a vhost for this site:
cat >//etc/httpd/conf.d/vhost_xhprof.conf <<EOF
<VirtualHost 203.0.113.123:80>
        ServerName profiler.example.com
        DocumentRoot /var/www/xhprof
</VirtualHost>
EOF
Optionally, to automatically run the profiling tool include this within the relevant vhost in your httpd config file.
php_admin_value auto_prepend_file "/var/www/xhprof-master/external/header.php"
That's about it for server setup so reload Apache's config files:
service httpd reload
Create a username, database and table for your data logging:
mysql -u root -p
mysql>CREATE DATABASE xhprof;
mysql>use xhprof;
mysql>GRANT ALL PRIVILEGES ON xhprof.* To 'xhprof'@'127.0.0.1' IDENTIFIED BY 'password' WITH GRANT OPTION;
mysql>CREATE TABLE `details` (
 `id` char(17) NOT NULL,
 `url` varchar(255) default NULL,
 `c_url` varchar(255) default NULL,
 `timestamp` timestamp NOT NULL default CURRENT_TIMESTAMP on update CURRENT_TIMESTAMP,
 `server name` varchar(64) default NULL,
 `perfdata` MEDIUMBLOB,
 `type` tinyint(4) default NULL,
 `cookie` BLOB,
 `post` BLOB,
 `get` BLOB,
 `pmu` int(11) unsigned default NULL,
 `wt` int(11) unsigned default NULL,
 `cpu` int(11) unsigned default NULL,
 `server_id` char(3) NOT NULL default 't11',
 `aggregateCalls_include` varchar(255) DEFAULT NULL,
 PRIMARY KEY  (`id`),
 KEY `url` (`url`),
 KEY `c_url` (`c_url`),
 KEY `cpu` (`cpu`),
 KEY `wt` (`wt`),
 KEY `pmu` (`pmu`),
 KEY `timestamp` (`timestamp`)
 ) ENGINE=MyISAM DEFAULT CHARSET=utf8;
And finally, either manually include header.php or, using the auto_prepend_file directive above, load a page and checkout the profile. By default a page will be randomly profiled 1 in 100 page-loads but you can explicitly request it by appending ?_profile=1 to your url. Eg: http://example.com/page?_profile=1. Once the page has loaded you'll see an extra link at the bottom of the page called "Profiler output" Follow this to see the profile. (This won't work if your site is beind a CDN so you might need to modify xhprof/external/header.php)
The next bit might require some real effort. Take a look at the profile and find the slow bits. Then make them better!
Have I missed anything? Let me know!
comments powered by Disqus